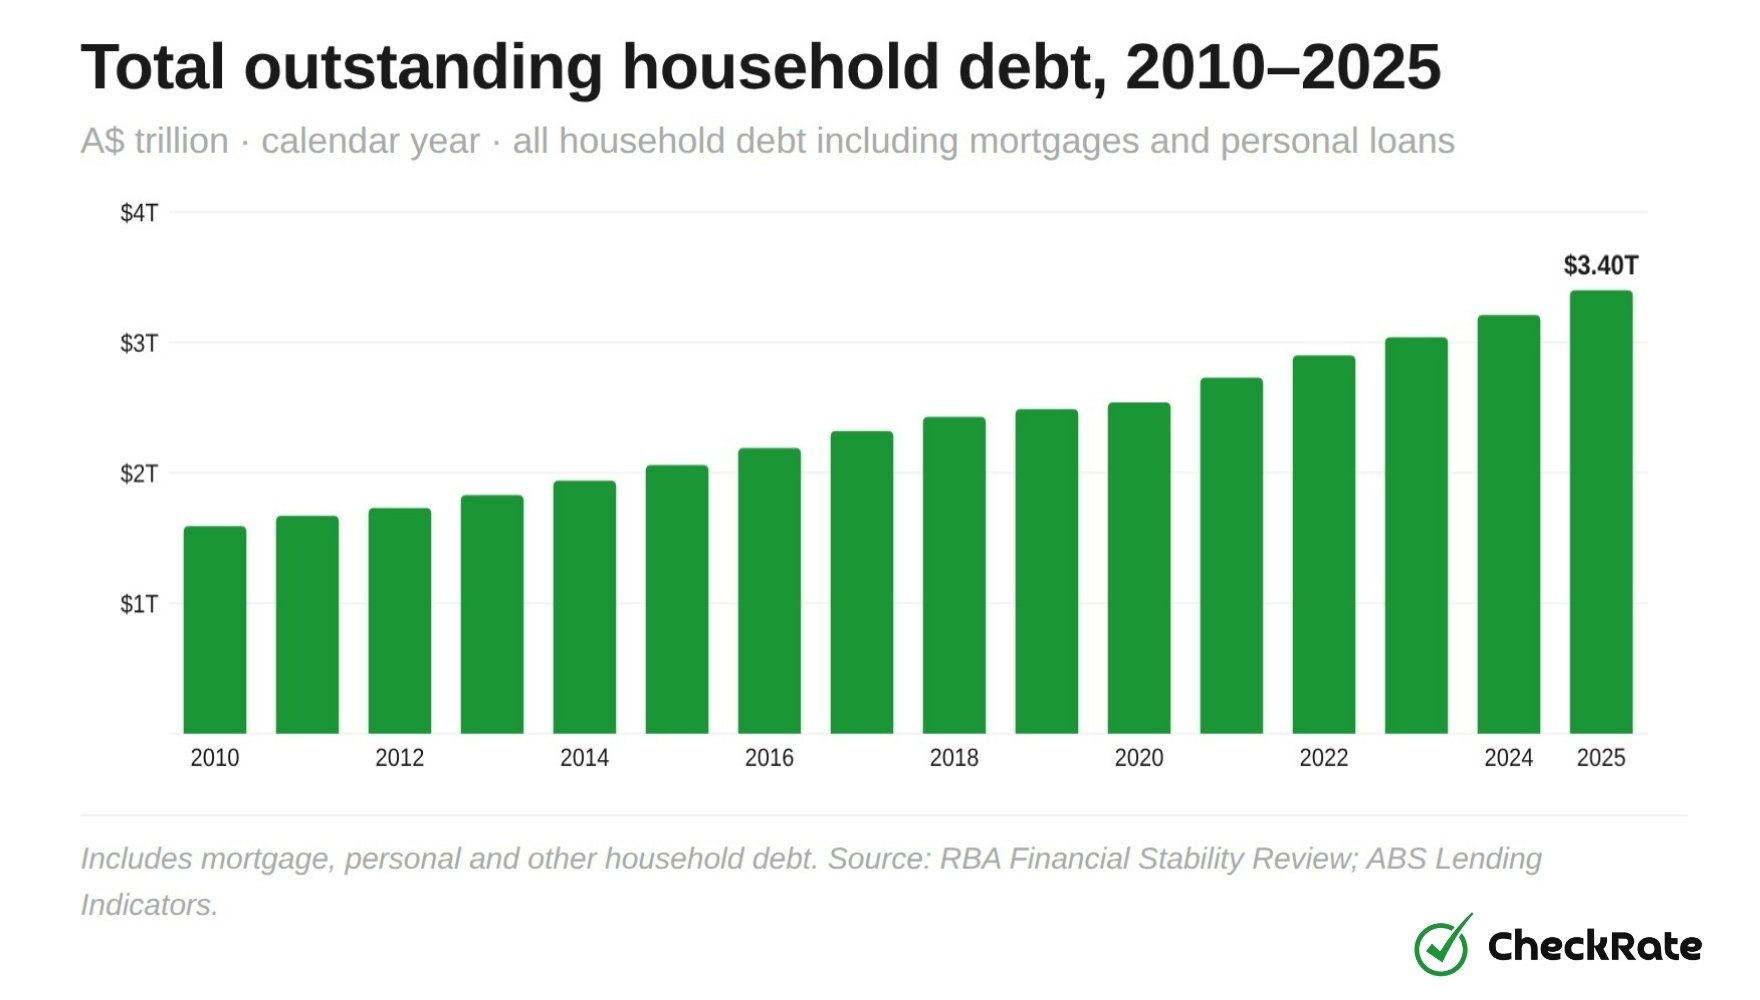
How much is Australia's total household debt?
As of December 2025, Australian households owe a combined $3.40 trillion, up from $2.06 trillion ten years earlier. That means household debt has grown by 65% in a decade, adding around $1.34 trillion to the national total. Based on projected household counts, this is about $313,633 per household, with most of this linked to mortgages. Compared with income, Australians now owe roughly 1.8 to 2.1 times their annual disposable income, placing Australia among the more highly indebted developed economies.
Source: ABS Australian National Accounts: Finance and Wealth.
Growth has been steady across the full period, with only a brief pause from 2019 to 2020. Since then, debt has grown by more than $850 billion as property prices rose sharply and borrowing expanded in the years before the 2022 rate rises. Nothing in the data suggests that the trajectory is changing.
What types of debt do Australian households carry?
Australian household debt is mainly tied to property. The ABS and RBA divide household debt into seven categories, but owner-occupier mortgages and investment property loans account for most of the total. Other types of debt, such as credit cards, personal loans and student loans, make up a much smaller share. This heavy reliance on housing debt helps explain why interest rate changes can have a direct effect on household budgets.
| Debt Type | Relative Size | Avg. Amount |
|---|---|---|
|
Owner-occupier mortgages
are the single largest liability and the primary driver of Australia's high debt-to-income ratio
|
|
$349,410 |
|
Investment property loans
Concentrated among older, upper-income households; subsidised by negative gearing
|
|
$337,577 |
|
Personal loans
are typically secured against vehicles and household goods
|
|
$14,704 |
|
Borrowings from other households
Informal loans from family and friends
|
|
$5,859 |
|
Credit card debt
is the most widely held type; total account numbers have been declining since 2017
|
|
$3,193 |
|
Payday loans
Concentrated in low-income households; carries predatory annualised interest rates
|
|
$1,222 |
|
Buy Now, Pay Later (BNPL)
High uptake among Gen Z (28%) and Millennials; often invisible on credit files
|
|
$633 |
Per-household averages use total ABS liabilities and projected 2025 household counts. HELP/HECS student debt is tracked separately and covered in its own section below.
"For the average Australian household, the mortgage is the debt. Everything else barely registers on the scale."
New dwelling loan commitments by year
New home loan commitments reached a record $106.98 billion in the December quarter of 2025. The trend over the past decade has been shaped by both lending rules and interest rate changes. Lending fell to a decade low of $49.85 billion in 2018 after APRA tightened credit standards, before surging during the pandemic as low interest rates and stimulus measures pushed commitments to $92.57 billion in 2021.
Owner-occupier first home buyers are a subset of total owner-occupier commitments. Other owner-occupier = total owner-occupier minus first home buyers. Loan commitments exclude refinancing.
Source: ABS Lending Indicators (trend series), December each year.
That momentum reversed during the RBA's rate-rise cycle in 2022 and 2023, when higher borrowing costs reduced lending activity, particularly among first-home buyers. Since mid-2024, lending has recovered steadily, with both owner-occupiers and investors returning to the market. By December 2025, total commitments had surpassed the previous pandemic-era peak.
Personal loan values by year
Personal fixed-term loan commitments reached $9.51 billion in the December quarter of 2025, the highest level in the series. Vehicle loans made up $4.80 billion, while $4.71 billion went to other purposes, including personal investment, travel and household goods.
Road vehicles include all motor vehicle loans. Other includes personal investment, travel and holidays, household goods, and other vehicles.
Source: ABS Lending Indicators.
The split shows how personal borrowing has changed over the past decade. Non-vehicle lending has roughly doubled since 2015, rising from $2.32 billion to almost match vehicle lending by 2025. This suggests Australians are using personal loans for a wider range of expenses, not only car purchases.
Personal loan commitments fell to $4.95 billion in December 2020, when vehicle supply chains were disrupted, and consumers pulled back on spending. Lending recovered from 2021 as supply improved and demand returned. By 2025, both vehicle and non-vehicle lending were contributing almost equally to the total.
Student debt (HELP/HECS) by year
Australia's total HELP debt reached $125.3 billion in FY2024-25, almost double the $62.9 billion recorded ten years earlier. The total has increased every year over the past decade, driven by rising enrolments, annual indexation on 1 June, and a labour market where many entry-level roles now require degree-level qualifications.
At this level, HELP debt is no longer only a personal finance issue; lenders include HELP repayments when assessing borrowing capacity, which can reduce how much some graduates can borrow for a home.
Each data point shows total incurred HELP debt at the end of that financial year. Includes all higher education and vocational training loans under the HELP scheme.
Source: APH HELP Statistics 2024–25.
2022
Annual indexation can cause HELP balances to grow even when graduates are making repayments, especially during periods of high inflation. Since HELP debt first crossed $100 billion in FY2021-22, the total has continued to rise by roughly $8 billion to $10 billion each year. This was most noticeable in 2022-23, when some borrowers saw their balance increase despite regular payments. For graduates hoping to buy a home, HELP repayments can reduce borrowing capacity at a time when property prices remain high.
How much do Australians owe on credit cards?
Credit card debt is smaller than mortgage, student and personal loan debt, but it remains important because unpaid balances usually attract high interest rates.
Total credit card balances and spending activity reached $345.2 billion in 2025, up 36% from $254.4 billion in 2015. Growth has not been steady. The figure reached $275.9 billion in 2018, then fell to $244.2 billion in 2020 as households reduced spending and paid down card debt during the pandemic.
Personal cards only. Excludes commercial and charge cards. The decline in 2020 reflects reduced consumer spending and accelerated repayment during the pandemic.
Source: RBA Credit and Charge Cards, C1.2.
Since 2021, the total has risen each year, reaching a new record in 2025. The average balance per household is $3,193, which is lower than other major debt types. However, unpaid credit card debt can still carry very high interest rates.
Which age group holds the most debt in Australia?
Debt does not fall evenly across age groups. Australians aged 35 to 44 carry the largest total, with an estimated $797.54 billion and a debt ratio of 1.73. This is the life stage where peak mortgage repayments, ongoing HELP debt and, for some households, investment property loans all run at the same time.
The ratio compares each group's share of total debt to its share of the population. A ratio above 1.0 means the group carries more than its proportional share of national debt. ★ Highest debt cohort.
Source: ABS 6523.0 Household Income and Wealth; RBA E2/E7 estimates.
The 25 to 34 group holds an estimated $525.55 billion with a ratio of 1.14, many of them navigating a first property purchase while still carrying HELP debt. Carrying both debts makes them more sensitive to rate rises and indexation changes. At the other end, Australians aged 65 and over hold just $82.98 billion, a ratio of 0.18, reflecting a lifetime of paying down debt. The youngest cohort, aged 15 to 24, carries $129.08 billion, mostly HELP debt and early personal borrowing, and that figure will grow considerably as they move towards homeownership over the next decade.
Financial stability and risk
At this scale, household debt makes Australian families more sensitive to changes in the economy. Most Australian mortgages are on variable or short fixed-rate terms, which means RBA rate changes can flow through to household budgets within weeks.
How many households are experiencing mortgage stress?
Around 1.56 million households are currently spending more than 30% of their gross income on mortgage repayments. At current debt levels, a sustained rise in interest rates or a fall in household income could push a meaningful share of those households into genuine financial difficulty.
How do interest rate changes affect household debt?
A 1% rise in the cash rate can add roughly $300 to $500 a month to repayments on an average mortgage, or up to $6,000 a year. On a balance of $313,633, even a 0.25% move can shift monthly repayments enough for households to notice.
- ABS Australian National Accounts: Finance and Wealth: household financial liabilities, quarterly series 2010–2025
- ABS Lending Indicators: new dwelling loan commitments by borrower type and purpose, trend series
- ABS Household Income and Wealth, Cat. 6523.0: average household debt by type, income and wealth classifications
- RBA Household Debt Key Statistics: debt-to-income ratios, mortgage stress estimates and household financial indicators
- RBA Credit and Charge Cards, C1.2: personal credit card balances, account numbers, original series 2014–2025
- RBA E2/E7 Household Debt Classifications: breakdown by ADIs, securitisers, general government and other financial corporations
- APH HELP Debt Statistics 2024–25: total incurred HELP debt by financial year, Department of Education data
- Data compiled from primary longitudinal datasets and quarterly financial accounts for 2010–2025. Per-household averages use projected 2025 ABS household counts. General information only — not financial advice.
Data Snapshots